The Warm California Sun
In general I think winters are the worst. The days are short and dreary. They are cold and wet. Thankfully, these types of days are often fewer around these parts than other places in the country. Today we will take a (quick) look at the sun and weather in different parts of California. One thing I wanted to do was work with time series data, so this provides a nice experience.
The data
There are two sources of data I explored. The first source is weather data from the National Oceanic and Atmospheric Administration (NOAA). The NOAA actually has an R package, rnoaa, which is an interface to all of their dataset APIs and is very useful. For this post, I only look at the calculated daily and yearly averages of temperature and rainfall (or precipitation) from 1981 to 2010. The second source is the US Naval Observatory website where I scraped sunrise and sunset times for current calendar year, 2017. It should be clear that these times generally only depend on latitude and day of the year, so there is little variation from say March 15 of 1917 and March 15 of 2017.
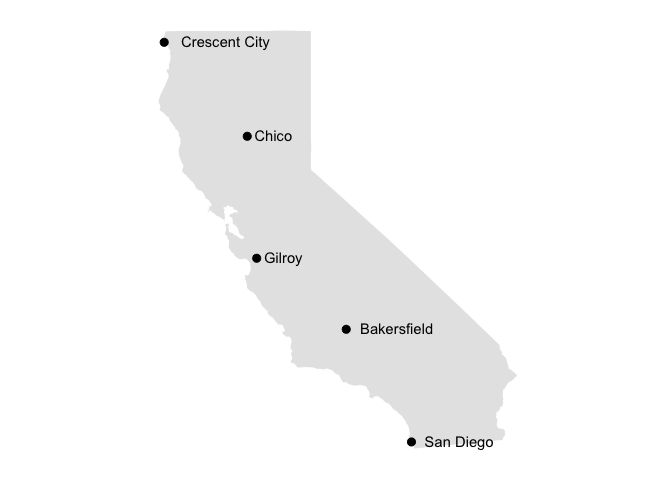
For both sources I took a look at five California cities. These cities were chosen to satisfy two criteria: equidistant from one another and popularity. That is to say, I wanted to choose five places that could represent the state geographically (from the perspective of latitude) and had some name recognition. These five cities are shown below.
Weather
As stated previously, the weather data shown in this section is the daily average collected over a period of three decades: 1981 to 2010. First we will take a look at the average precipitation per calendar day.
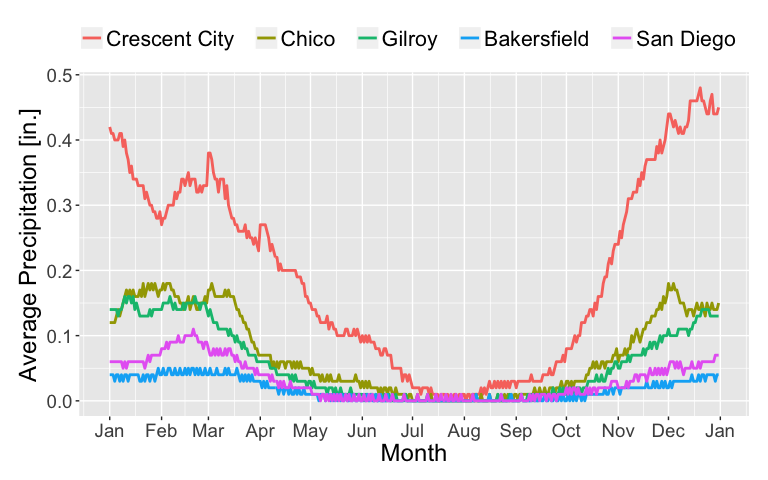
The trends do not look surprising. There is more rain in the winter than summer months. Bakersfield does not get a lot of rain; it is in the Central Valley. As one of the northern-most cities in California, Crescent City tends to get quite a lot of rain throughout the year. In fact it is one of the wettest cities in the state. We can compare also to the national annual average annual precipitation and number of rainy days. The table below summarizes this.
| Location | Ave. Annual Rainfall [in.] | Ave. Annual Rainy Days |
|---|---|---|
| Chico | 26.67 | 65.6 |
| Crescent City | 71.24 | 111.8 |
| Gilroy | 20.54 | 59.9 |
| Bakersfield | 6.47 | 39.2 |
| San Diego | 11.16 | 43.3 |
| US Average | 35.31 | 96.8 |
We can see indeed that Crescent City is above average compared to the rest of the country. Perhaps not surprisingly, the other four cities are all below national averages.
The typical temperatures of these places is also important. Below is a plot of the temperature per calendar day split into five panels for the five different selected cities. The solid line is the average daily temperature while the two dotted lines are the daily maximum and minimum temperatures. Surrounding the solid line is a transparent band of color representing one standard deviation of the average temperature calculation.
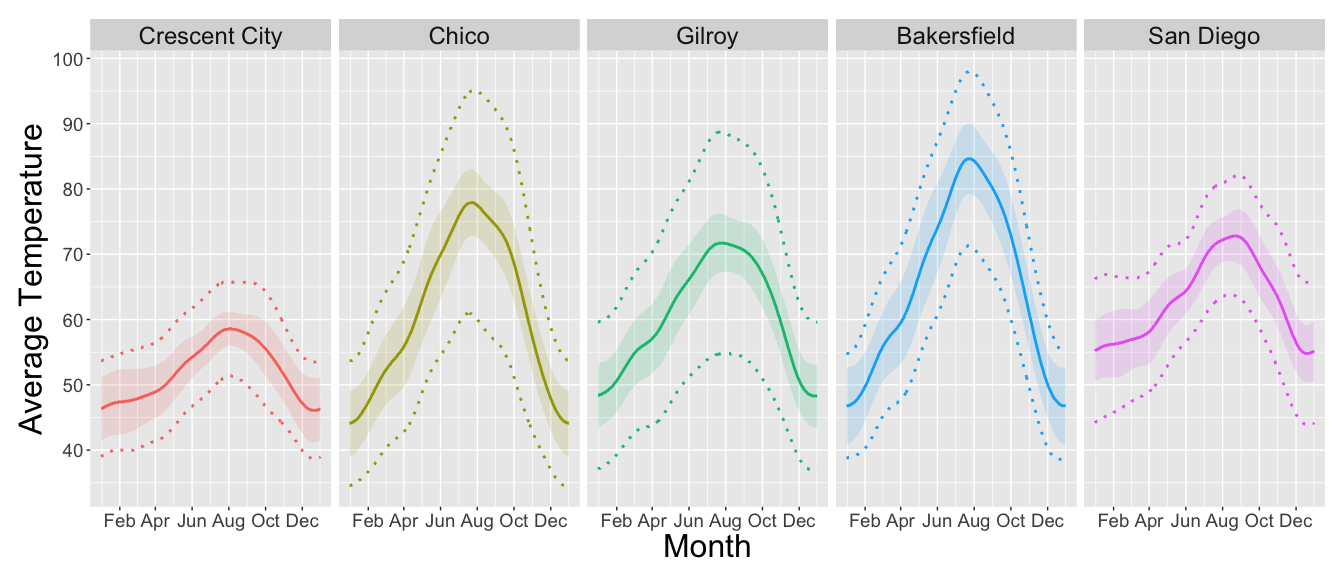
The two cities on the coast display a smaller seasonal temperature variation. This makes sense: the Pacific Ocean acts as a regulator. The inland cities tend to not display this behavior. Singling Bakersfield out again, we see that it has hot summer days and cold winter days.
Sunlight
Moving right along, the other aspect I explored was how sunrise and sunset looks in California. Another reason to love summer is the longer days. It allows for more outdoor activities and later bedtimes, meaning more fun. Let’s check out when the sun rises on California.
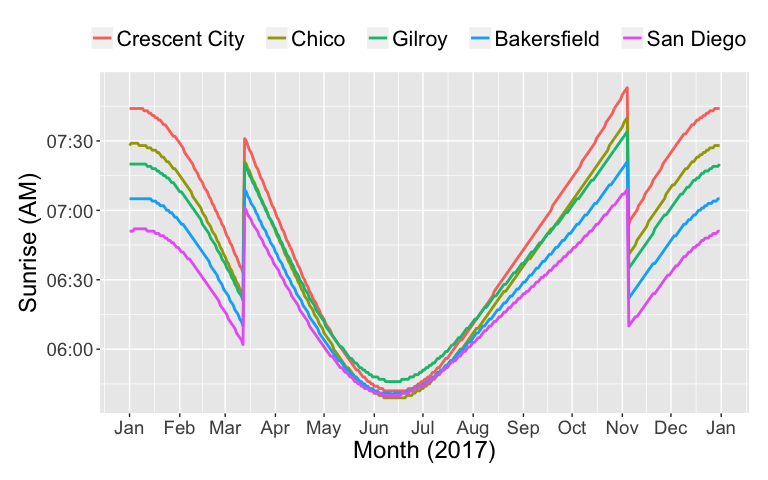
One might be initially surprised by the sudden jump around March and November, but it is easy enough to remember that it is due to Daylight Savings Time (DST). Remembering Daylight Savings Time (DST), the plot does not have any surprises. There is a clear separation in the winter months between the five cities, but this separation is relatively minimal during the summer months. The opposite trend is displayed in the sunset plot below.
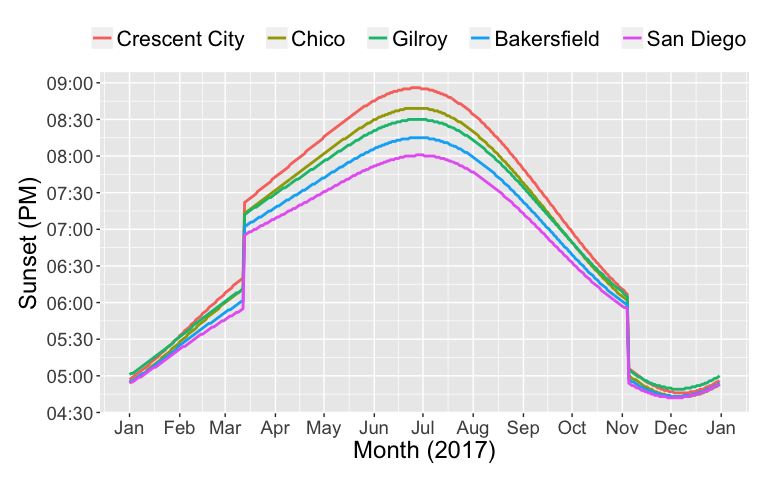
The clear distinction in time is during the summer months instead, with similar times during the winter months. This reason should be clear, as the tilt of the Earth’s spin axis changes relative to the orbital plane. This leads into the final plot of the day which calculates the daylight amount for each of the five cities. This measure of course ignores clouds and other weather patterns.
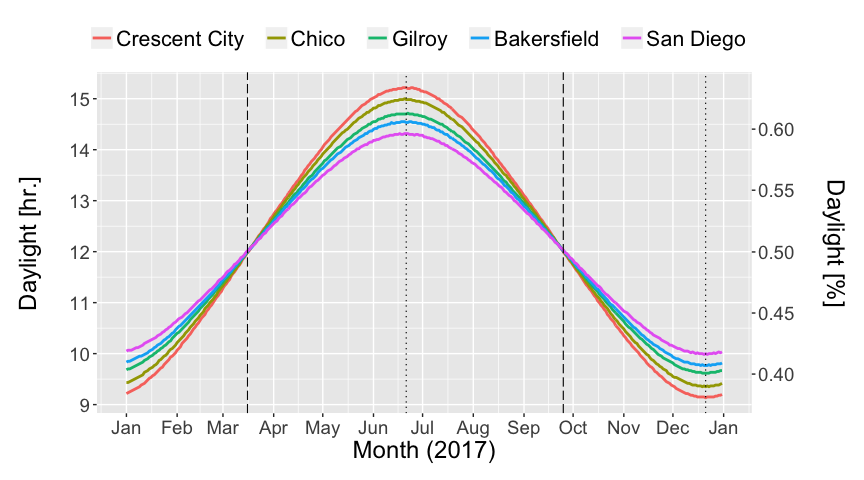
Four dashed lines are also drawn to help guide the eye: long dashed lines represent the two equinoxes and the short dashed lines represent the two solstices. Crescent City can have over 15 hours of daylight around the summer solstice. This represents about 63% of the day. Its not too bad in the other cities either, with San Diego still having daylight for almost 14.5 hours.
Parting thoughts
Today I just wanted to take a peek at some time series data about weather and sunlight patterns for California. I was exposed to some more packages and data sources. I showed some plots for a few selected cities throughout the state including average rainfall, average temperature, and sunlight as functions of the day of the year. It was a fun little exercise and perhaps the Golden State is golden for more than just the metal.