NBA Standings Reimagined
Sometime last week as I was looking at the NBA playoff match-ups a thought occurred to me. What if the NBA standings adopted a points system á la European soccer leagues instead of win percentage? One might ask what the difference even is and it is quite simple. The winner of a game is given three points while the loser gets none. Crucially, a tie game results in one point for both teams. Currently, of course, the NBA resolves ties with overtime periods until there is a winner. From here a simple ratio of games won by games played is calculated to rank teams.
Today’s post will reimagine the NBA standings using points instead of win percentage.
The data
I scraped the data available at the wonderful Basketball Reference to get the results of every game for every team since the 2004-2005 season. This season was chosen as the cutoff as this was when the 30th team was added to the NBA, the New Orleans Pelicans franchise. I also scraped the Land of Basketball website to get the yearly final standings. Because division winners and tie breakers alter, sometimes significantly, a simple ranking of teams by win percentage, I wanted to ensure I used the correct standings (see e.g. this).
I used the game results data to turn all games that went to overtime into ties. This meant the winning teams lost credit for a victory while losing teams gained credit. From here, I tallied each teams points total to get a new ranking of teams. Of course this is a what-if scenario, which if put into practice would likely meaningfully change late-game tactics and strategies.
Also note the league is divided into two conferences based on geographic location: the East and West. The visualizations below will reflect this division. As usual, I used R for the data gathering, cleaning and visualizing.
The 2017 NBA Playoffs
The charts below show all fifteen teams in the West alongside two columns. The columns are the win percentage and points total for each team, respectively. The colors indicate how the positions of a team might change with the new ranking scheme. Note only the top eight teams get into the playoffs with the rest eliminated and entered into the NBA Draft Lottery. Let’s first take a look at the present (2016-2017) season in the Western conference.

There is no change at the top. If anything the gulf between the first place Warriors and everyone else is further enhanced. But if we scan to the bottom of the playoff teams we notice that in our points system, the Nuggets would have made the playoffs! Sorry Denver. They were only a single game behind the Trail Blazers. But the Blazers were involved in nine overtime games vs. the Nuggets three, so under our points system, the Nuggets would have leap-frogged not just one, but two teams. Other than this tidbit, not much else changes in the West. The East, however, does have more going on.
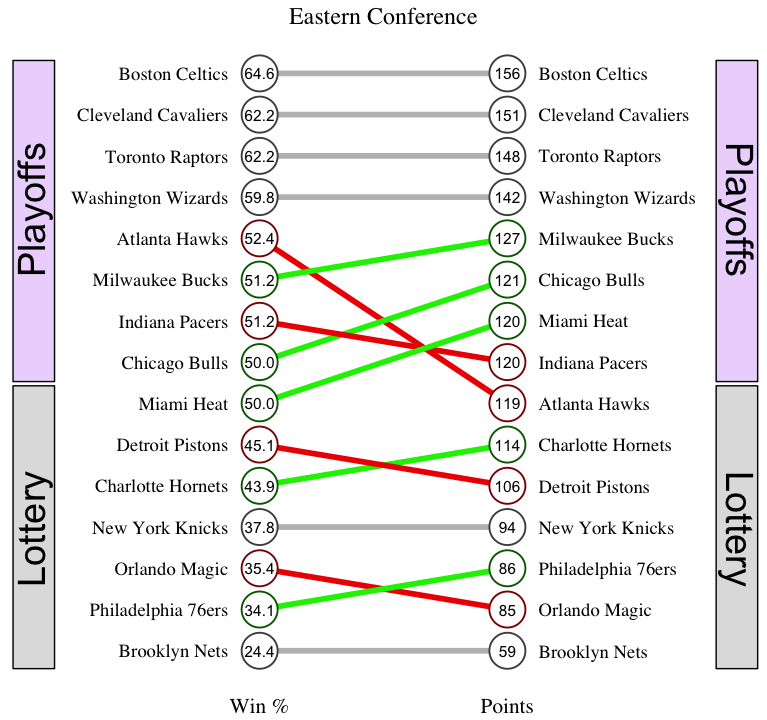
Just like the West, there is one team that makes the playoffs under the points system: the Heat. In this case, the Hawks make way. Even more interesting is the fall from the Hawks, who go from fifth to ninth place and completely out of the playoffs. There is also a re-shuffle amongst the lower half of the playoff teams with very different proposed first-round matchups. The lottery teams also see some changes.
Changes by season
While it was nice to see a single season’s changes with my proposed system, its easier to see the effect in a more graphical form. The plots below show the same information but with the x-axis showing all the seasons I scraped (except the current one). The y-axis is now just the rank under the current, win percentage, system. It is also split into the playoff teams and the lottery teams. The tiles then show the changes (if any) which occur when I apply my points system to the rankings. In the interest of brevity, teams are omitted from this graphic. The standings can be easily looked up however, like at the Land of Basketball.
The Western conference is shown below. For example in the 2010-2011 season, the fourth-placed team (Thunder) would swap places with the fifth-placed team (Nuggets) if the points system was used instead of the win percentage system.
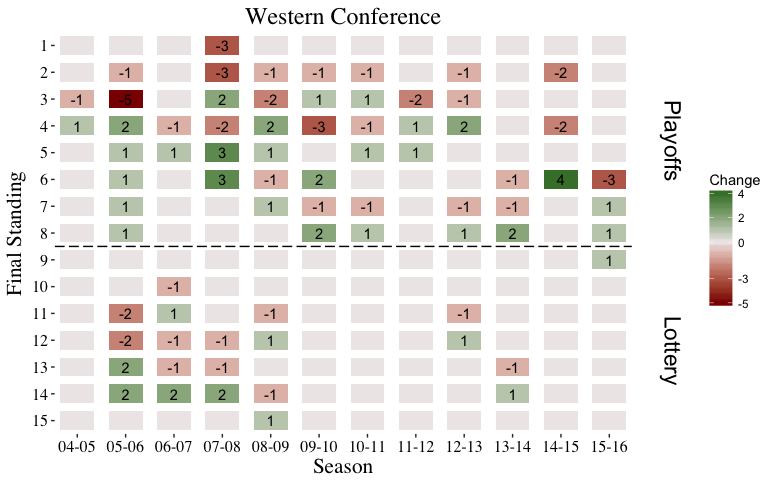
One can see there are no shakeups on which teams make the playoffs, except for last season. But there are changes to what the matchups actually are. No season goes unchanged. It is interesting to see the potential differences the point totals can make.
Switching to the the East, we can see similar behavior. The East had four seasons where a team would have snuck into the playoffs.
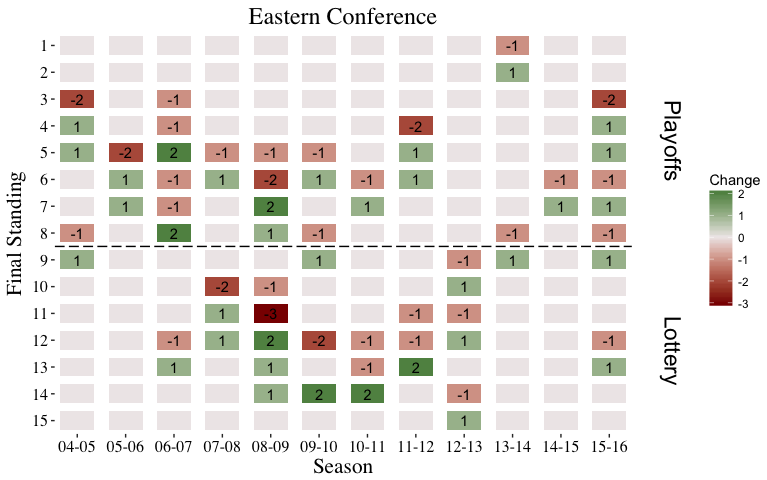
On average, every three years a team drops out of the playoffs. There are also lots of changes amongst the lottery teams. Interestngly, the West tended to have its changes more amongst its playoff teams. We can calculate the percentage of the number of changes occuring amongst the playoff teams vs. the total changes. For the Western and Eastern conferences, these numbers are 71 and 56 percentage, respectively. This also tells us the East tended to have the changes relatively evenly spaced between the playoff and lottery teams.
Parting thoughts
While not earth shattering, replacing win percentage with points would be meaningful in the NBA. Not only would it affect the playoffs, but it would also influence the draft. This will not come to fruition (ever), but it was a fun little thought experiment I wanted to do.