Trees from Zürich
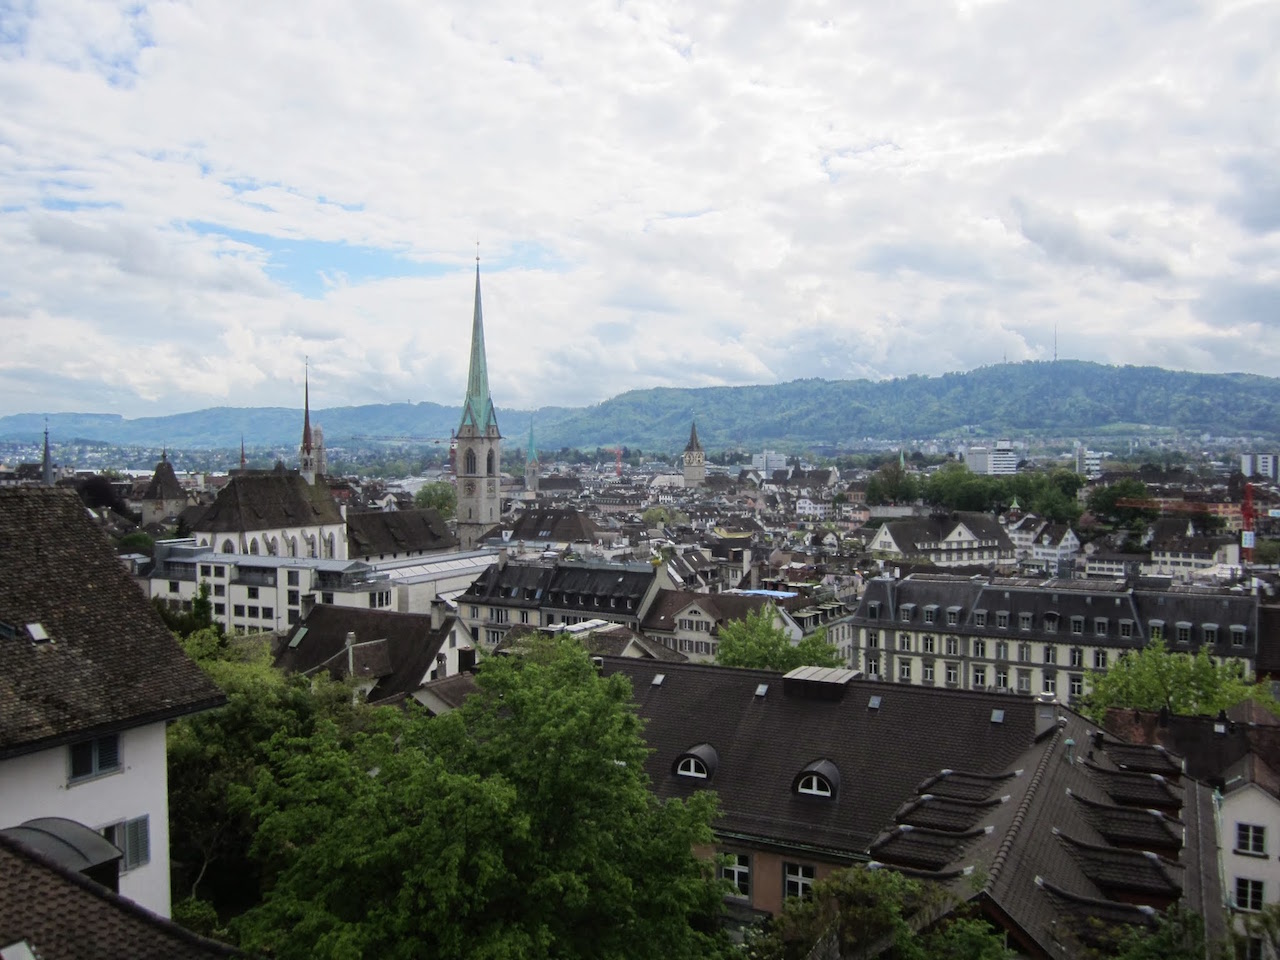
An underrated city in Europe, Zürich is lively and vibrant and one of my favorite places to visit. I bring this up because as I was stumbling around (on the internet) I found a dataset of trees on the OpenData Zürich website. It turns out most of the urban trees are indexed and alongside some supplemental sources make up this public dataset. I have many fond memories of Zürich and its arboretum, so today I will take a rather quick look at the trees from Zürich using R.
The data
As I already mentioned, this dataset comes from the city of Zürich. It provides some fifty-six thousand trees with their scientific name, location in latitude and longitude, year it was planted, in addition to other information. Of course, this is not an exhaustive list of all trees in Zürich. For instance, trees on private property are not likely to be counted here.
The viz
The first thing I plotted was when the trees were planted Around fifteen thousand trees did not have this information, so I discarded them for this plot.
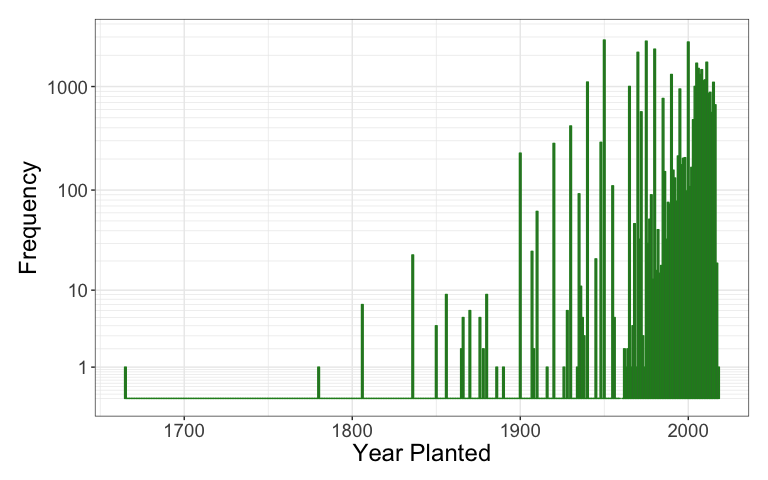
Whoa. There are some old trees in Zürich! The oldest tree, a downy Japanese-maple, was planted in 1660. Several more trees were planted before the (American) Civil War. This type of history is often pretty awe-inspiring, at least to me. But let’s take a closer look to more recent times with a focus on the last century or so.
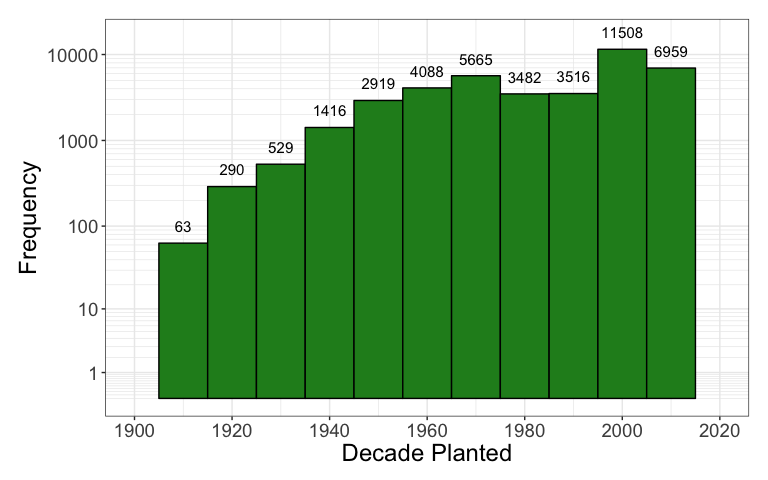
In this last plot I also re-binned to the decade instead of the year. While this does remove some information, it also gets rid of some of the ‘spiky’ nature these datasets tend to have. The general trend should be clear, however; more trees are being planted as the years progress.
The last thing I wanted to visualize was where these trees are. The map below shows all the trees in this dataset separated by two categories: trees planted in a park (orange) or on a roadside (blue). I used the beautiful Stamen Maps from the very handy ggmap package to produce the underlying map.
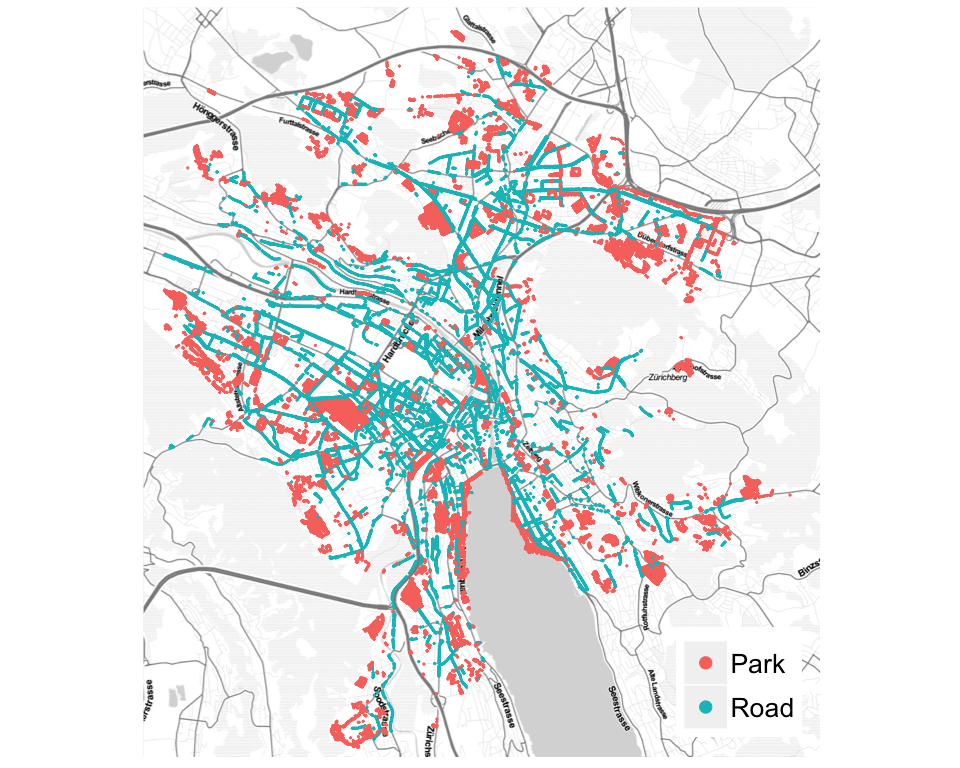
There are no surprises here. The orange dots tend to clump together (in parks) and the blue dots tend to be in lines (following a road). I mostly just wanted to make this type of pretty plot when I came across the dataset just to see all the little dots populate the city. It is also not the only city to keep (public) records of trees within its borders, so its neat to see what kinds of information is available to the public.
Parting thoughts
Today I just wanted to highlight how easily visualizations can be made for even the most basic of data. In this case, I wanted to map the trees in Zürich. Producing this post was nice also because of the warm memories I have from Zürich. Someday perhaps there will be a return trip and another view like this!